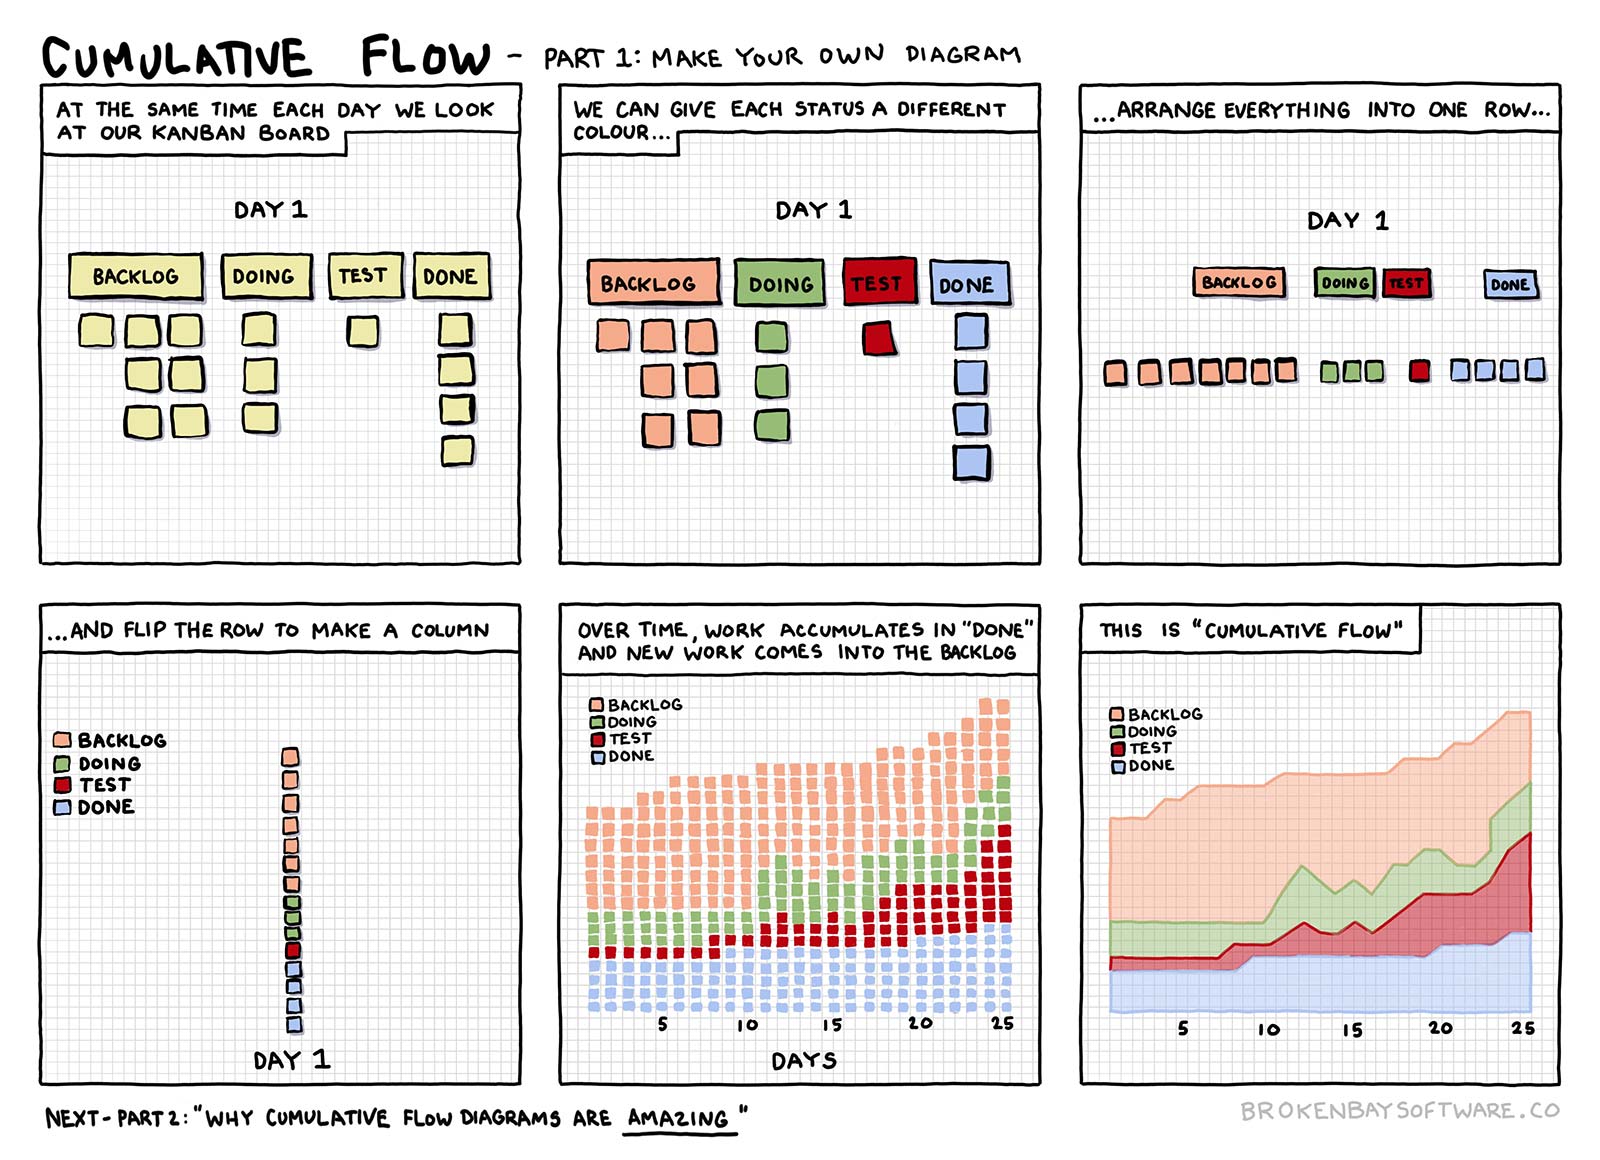
I use Cumulative Flow Diagrams for spotting problems and as a communication tool for discussions with the team. I’m using Google Sheets to keep track of how many cards are in each column of our Kanban board. Every morning I have a coffee and add a row for the day before.
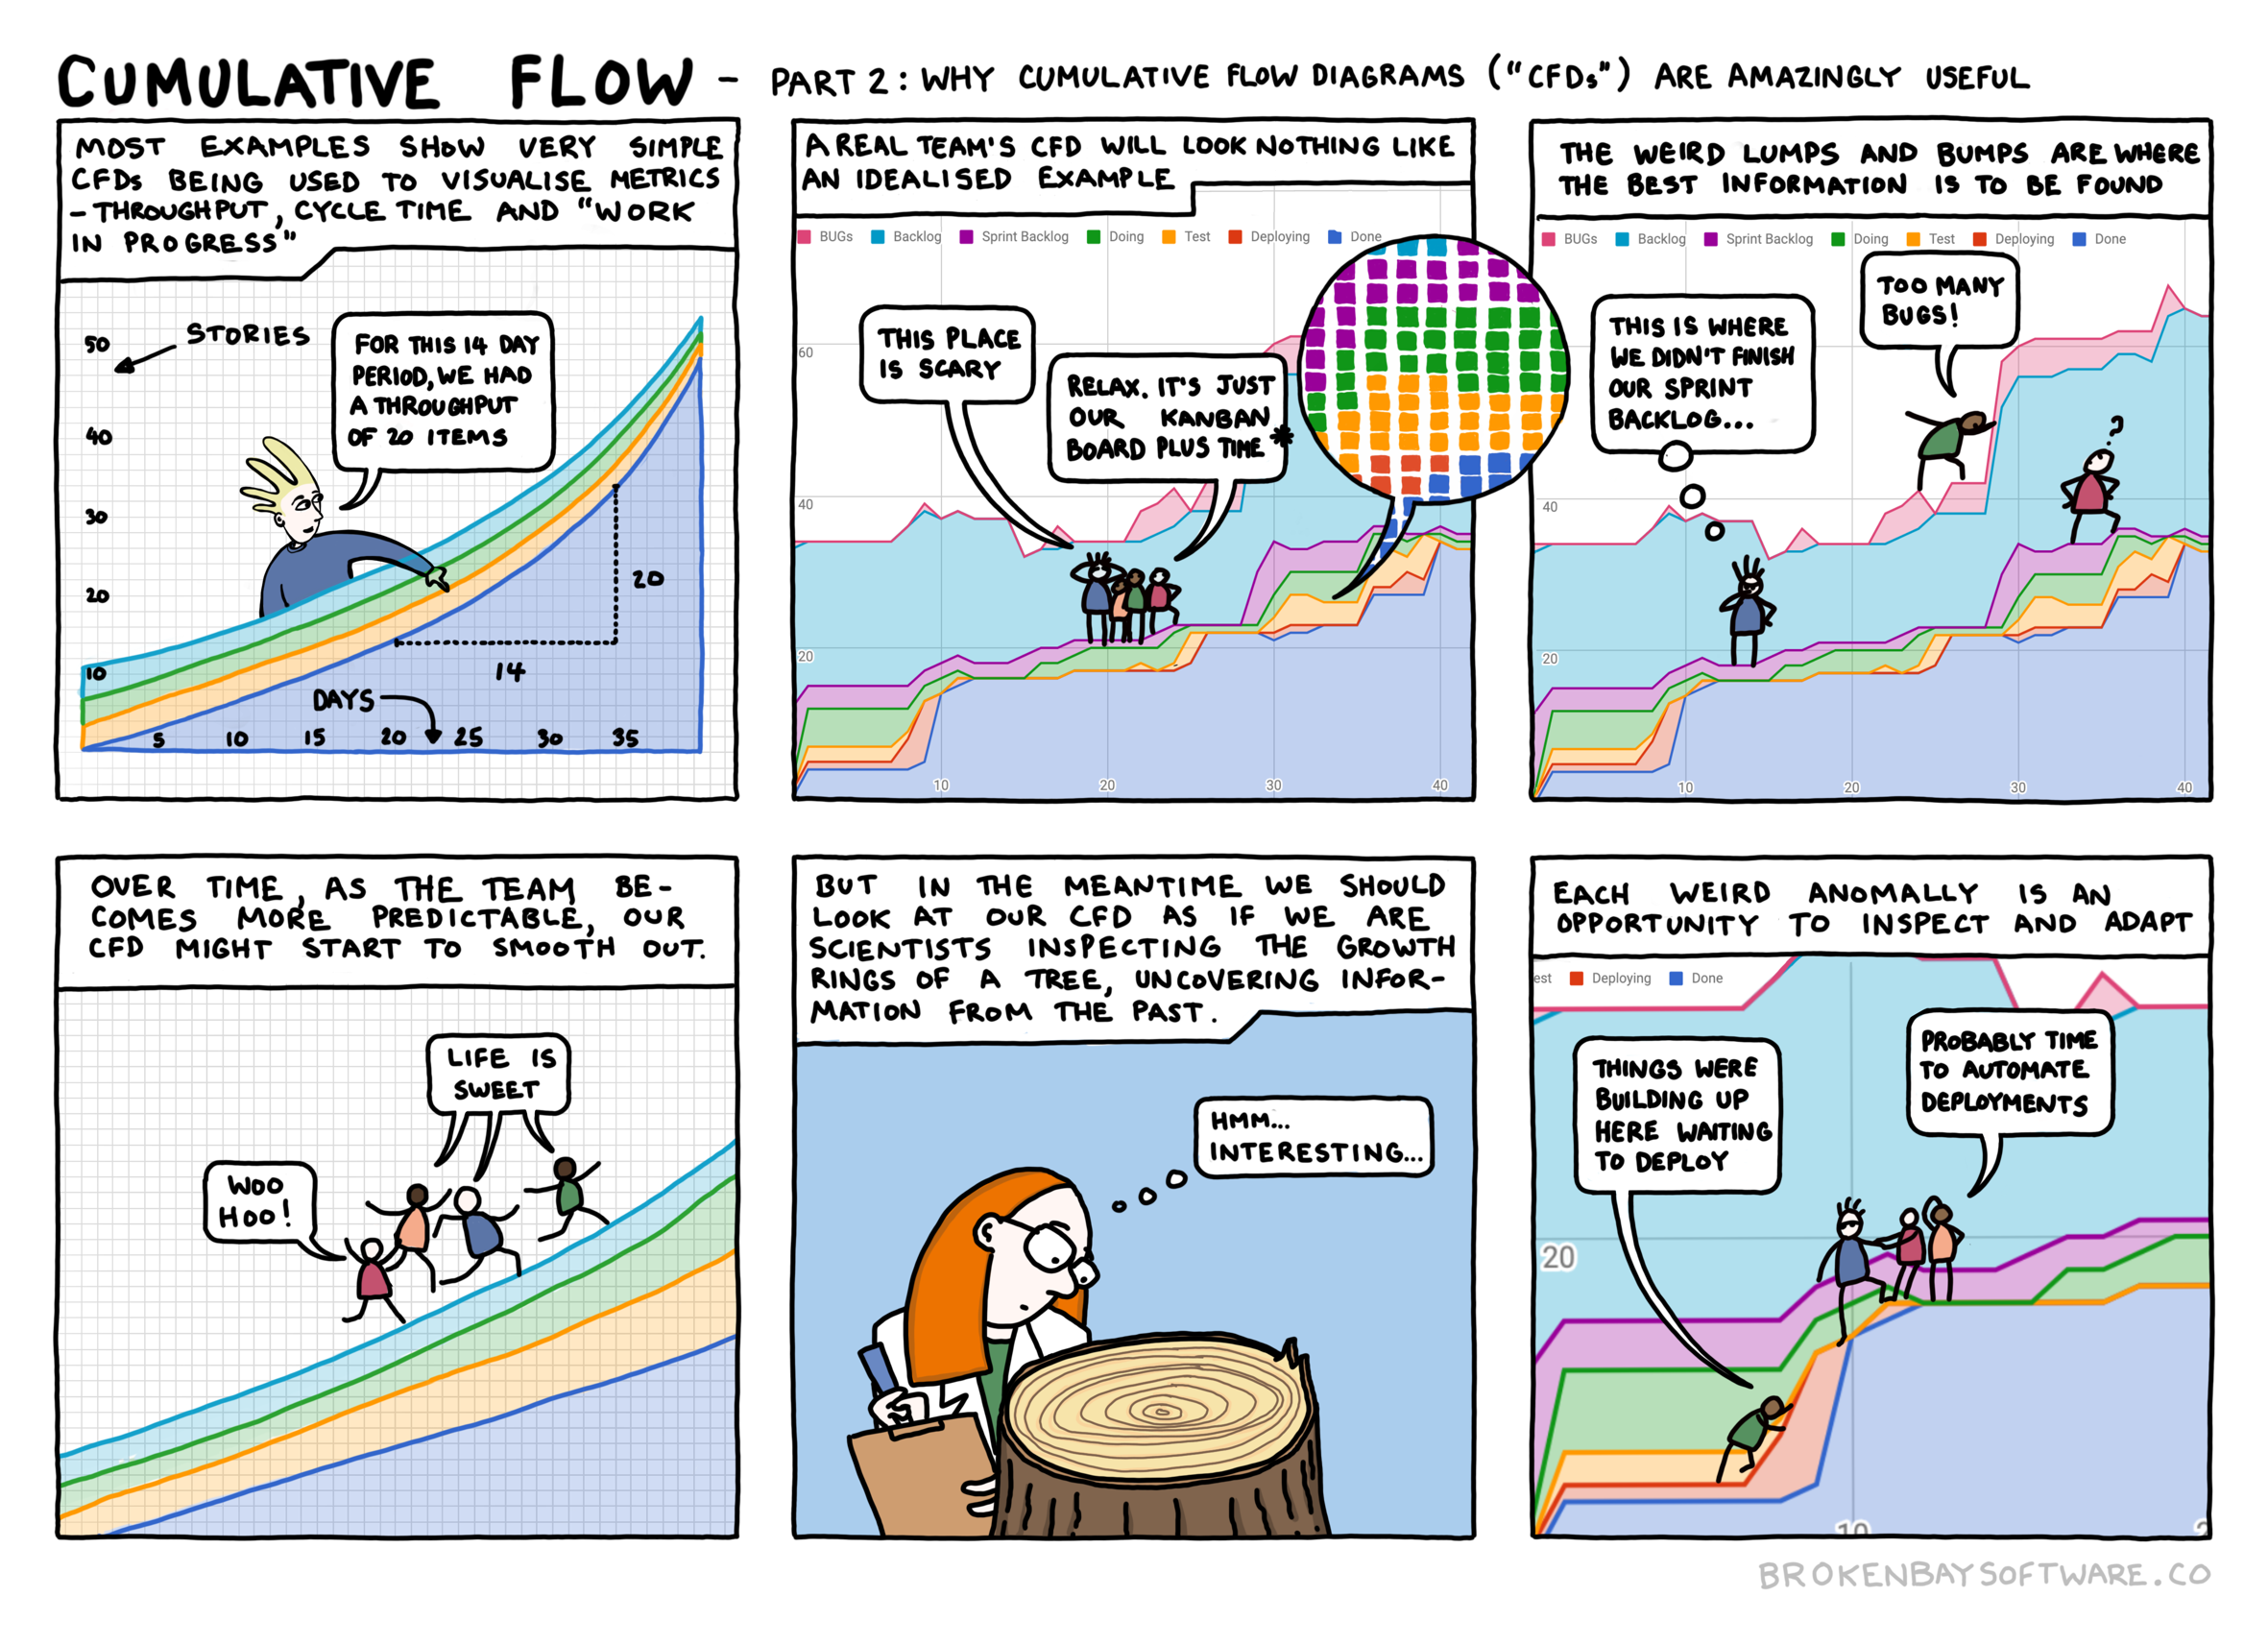
In Google Sheets, the CFD is a “stacked area chart”. A CFD based on real team data is crazy looking compared to most examples you see, which are usually simplified views of very stable systems. A real CFD shows the peculiar conditions of the team. I value that more than the throughput, cycle time and lead time metrics although these are important metrics that can have real value for the team.